 Back to sepiabio.com
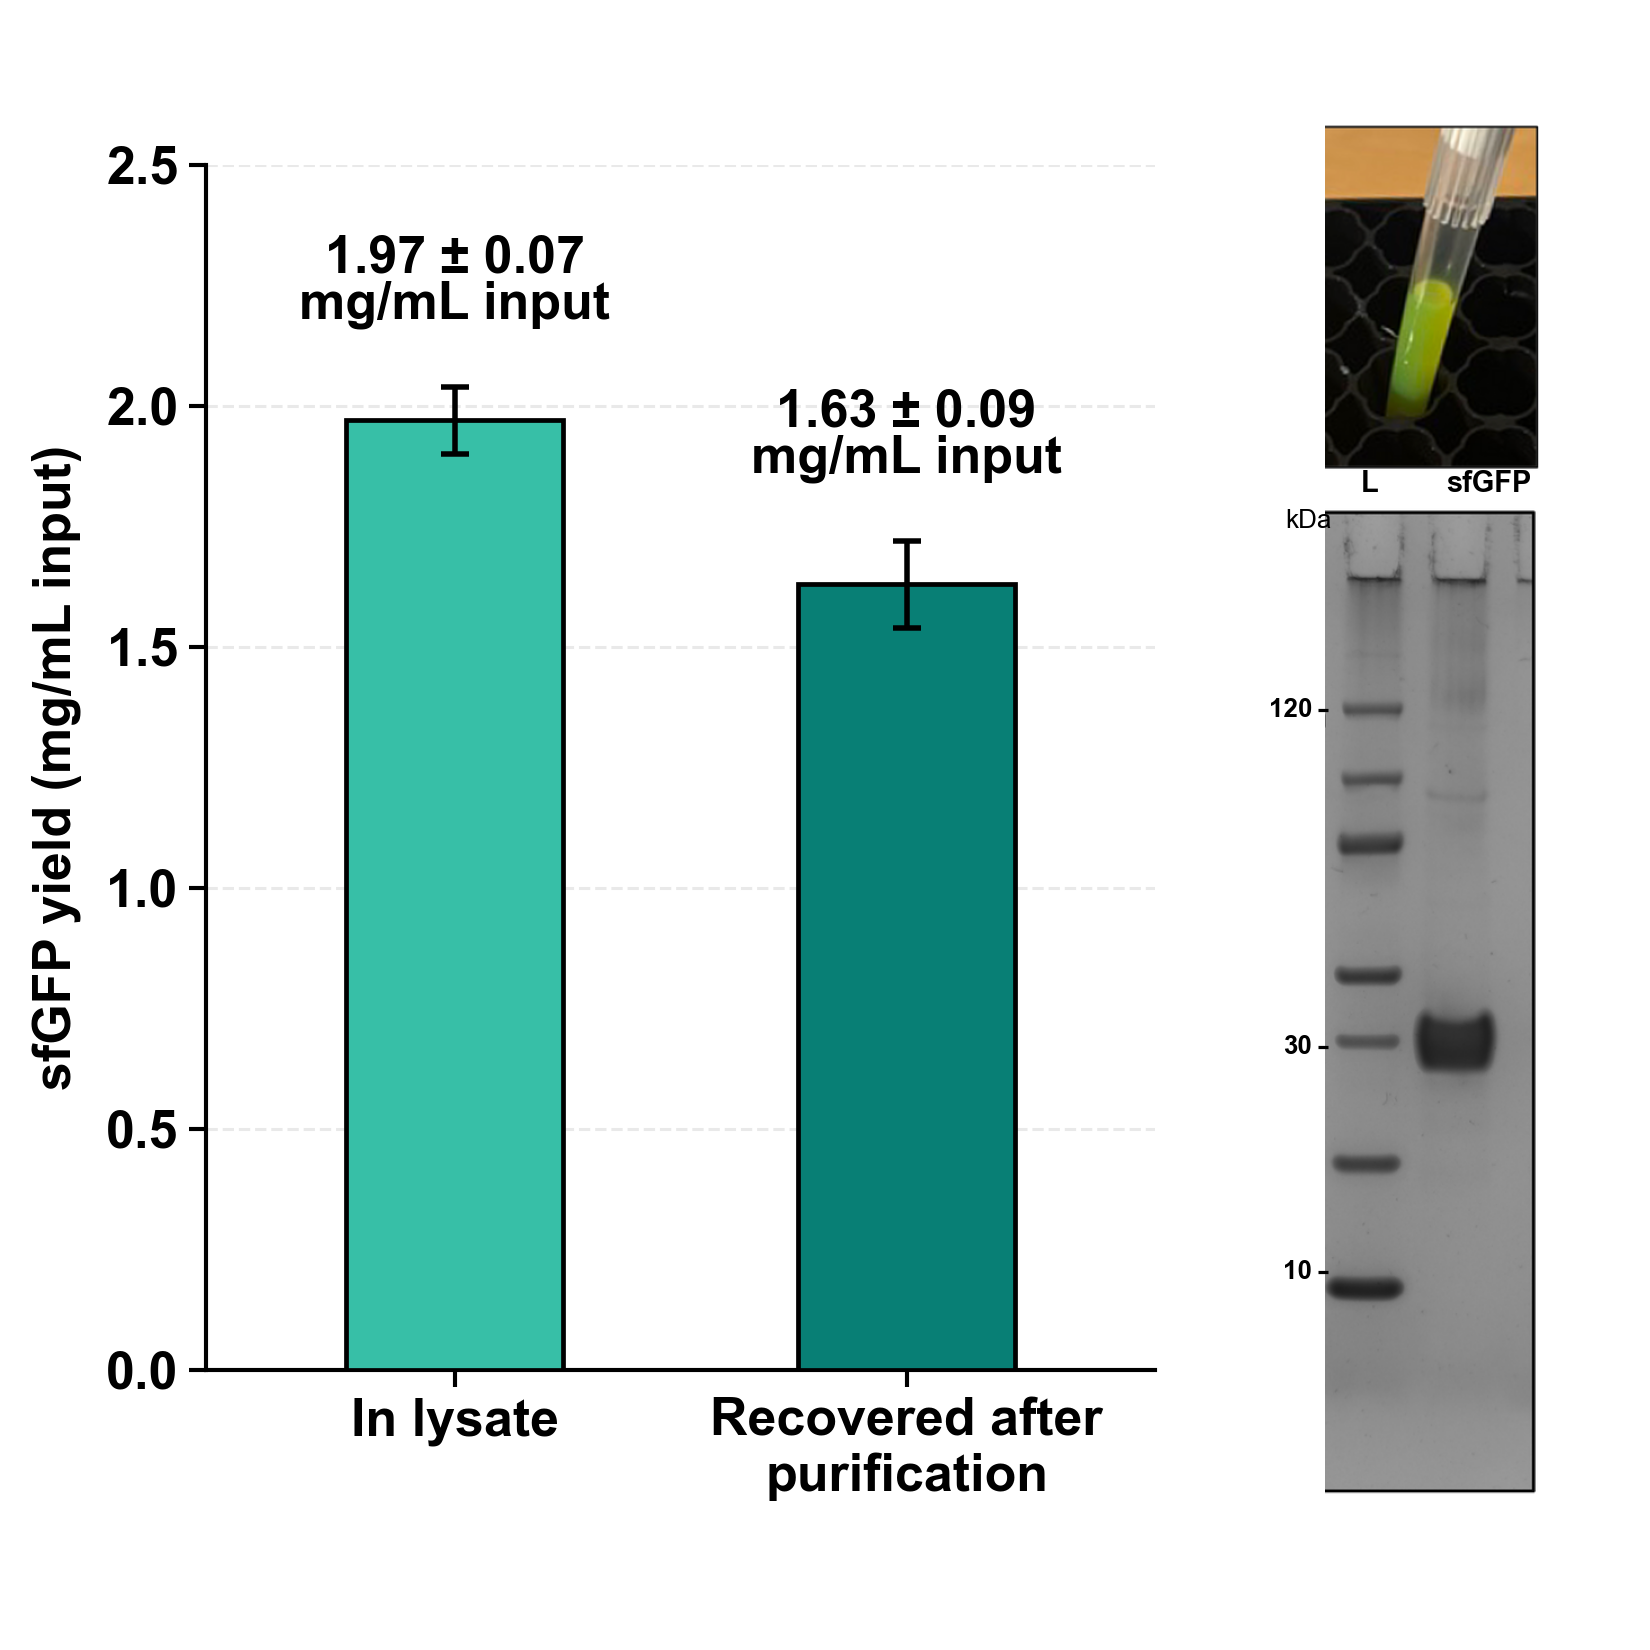
Figure 3. The OpenCFPS™ E. coli Core Kit produces approximately 2 mg/mL sfGFP at scale. Three 1.05 mL reactions expressing sfGFP from Control Plasmid DNA pS-T7-sfGFP r1 were incubated in a FlowerPlate™ at 29 °C for 12 h and purified by Ni-NTA. Shown are in-lysate concentration and recovered yield normalized to input lysate (left), lysate after expression (top right), and SDS-PAGE of a 5 µg pooled purified-protein load (bottom right).
Control Plasmid DNA pS-T7-sfGFP r1 (lot D000126041501) was generated by Biozilla (Ho Chi Minh City, Vietnam) as a gigaprep, eluted in 10 mM Tris, pH 8.5, quantified by absorbance at 260 nm, and normalized to 200 nM. Full sequences are provided.
Cell-free reactions were performed in triplicate at 1.05 mL in a FlowerPlate (Beckman Coulter, USA). Reactions contained 30% Sepia Extract E0002 lot E000225121803, 40% Sepia Buffer B0001 lot B000126022403, 2% of a 200 nM plasmid DNA stock, and 28% water. Reactions were independently set up by hand. Unused wells were filled with 1.05 mL water.
After setup, the plate was covered with Breathe-Easier film (Diversified Biotech, Massachusetts, USA), covered with a wet paper towel, and placed in a ThermoMixer C with flat plate adapter and cover (Eppendorf, Hamburg, Germany). Reactions were shaken at 650 rpm and 29 °C for 12 h, then held at 4 °C. A 750 µL aliquot of each reaction was removed for purification; the remainder was retained for calibration.
Each 750 µL aliquot was pelleted at high speed in a microcentrifuge, and the clarified lysate was retained. For each sample, 400 µL of GenScript Ni-Charged MagBeads L0295 (GenScript, Nanjing, China) was equilibrated three times with 1 mL Equilibration Buffer (50 mM HEPES, pH 8.0; 14 mM magnesium glutamate; 60 mM potassium glutamate) using a DynaMag-2 Bead Separator (Invitrogen, California, USA). Clarified lysate was mixed with the beads for 60 min at room temperature. The post-binding flow-through was removed, and the beads were washed three times with 1 mL Wash Buffer (50 mM monosodium phosphate, 300 mM sodium chloride, 10 mM imidazole, pH 7.4). Protein was eluted twice with 500 µL Elution Buffer (50 mM monosodium phosphate, 300 mM sodium chloride, 250 mM imidazole, pH 7.4) for 5 min at room temperature.
Combined eluates were buffer-exchanged into Storage Buffer (25 mM Tris-HCl, 100 mM sodium chloride, 50% glycerol, pH 7.4) using a 10 kDa Amicon Ultra-15 (Merck, Darmstadt, Germany). Protein concentration was measured by A280 using a DS-11 FX+ (DeNovix, Delaware, USA), Storage Buffer as the blank, molecular weight 26.640 kDa, and reduced-protein ε280 = 18,910 M−1 cm−1. Recovered solution volume was calculated from net solution mass using 1.15 g/mL; recovered protein mass was A280 concentration × recovered volume, and recovered yield was mass ÷ 0.750 mL input lysate. Approximately 1.67 µg from each purified sample was pooled (5 µg total in 2 µL) and loaded in one lane of a reducing 4-12% SurePAGE Bis-Tris gel. Samples were denatured with LDS Reducing Agent and 50 mM DTT at 70 °C for 10 min and run with 5 µL PAGE-MASTER Protein Standard (GenScript, Nanjing, China). The gel was stained with Coomassie SafeStain (Invitrogen, California, USA) and imaged.
Purified S1 was measured at 4.621 mg/mL by A280 and used as the stock for a twofold dilution series alongside 100 µM fluorescein and S1-S3 pre-purification lysate dilution series. Samples were dispensed at 10 µL in a 384-well flat-bottom plate 0720111 (Corning, New York, USA) using a Formulatrix Mantis v3.3 ACC RFID (Formulatrix, Massachusetts, USA). Fluorescence was measured on a BioTek Synergy Neo2 (Agilent, California, USA) using 485/20 nm excitation, 528/20 nm emission, bottom optics, and gain 35. In-lysate concentrations were calculated from the common linear-range relationship to purified S1.
A280-quantified purified S1 stock at 4.621 mg/mL, fluorescein at 100 µM, and S1-S3 lysates were serially diluted twofold. Endpoint mg/mL aligns undiluted lysate to the purified-S1 curve fit; linear-region mg/mL uses the shared linear range. Endpoint and linear-region RFE values use the corresponding fluorescein calibration.
| Sample | Endpoint mg/mL | Linear-region mg/mL | Endpoint RFE µM | Linear-region RFE µM |
|---|---|---|---|---|
| s1-lysate | 1.88 | 1.99 | 39.03 | 43.83 |
| s2-lysate | 1.69 | 2.03 | 35.91 | 44.64 |
| s3-lysate | 2.08 | 1.89 | 42.35 | 41.56 |
A280 reports the protein concentration in the recovered liquid. To compare recovery with the original lysate, recovered volume was calculated as net solution mass ÷ 1.15 g/mL, total recovered protein as A280 concentration × recovered volume, and recovered yield as total recovered protein ÷ 0.750 mL input lysate. The normalized yield is not the eluate concentration.
| Sample | A280 (mg/mL) | Net mass (g) | Recovered volume (mL) | Recovered protein (mg) | Yield (mg/mL input) |
|---|---|---|---|---|---|
| S1-purified | 4.621 | 0.314 | 0.273 | 1.262 | 1.682 |
| S2-purified | 4.622 | 0.313 | 0.272 | 1.258 | 1.677 |
| S3-purified | 3.212 | 0.411 | 0.357 | 1.148 | 1.531 |