 Back to sepiabio.com
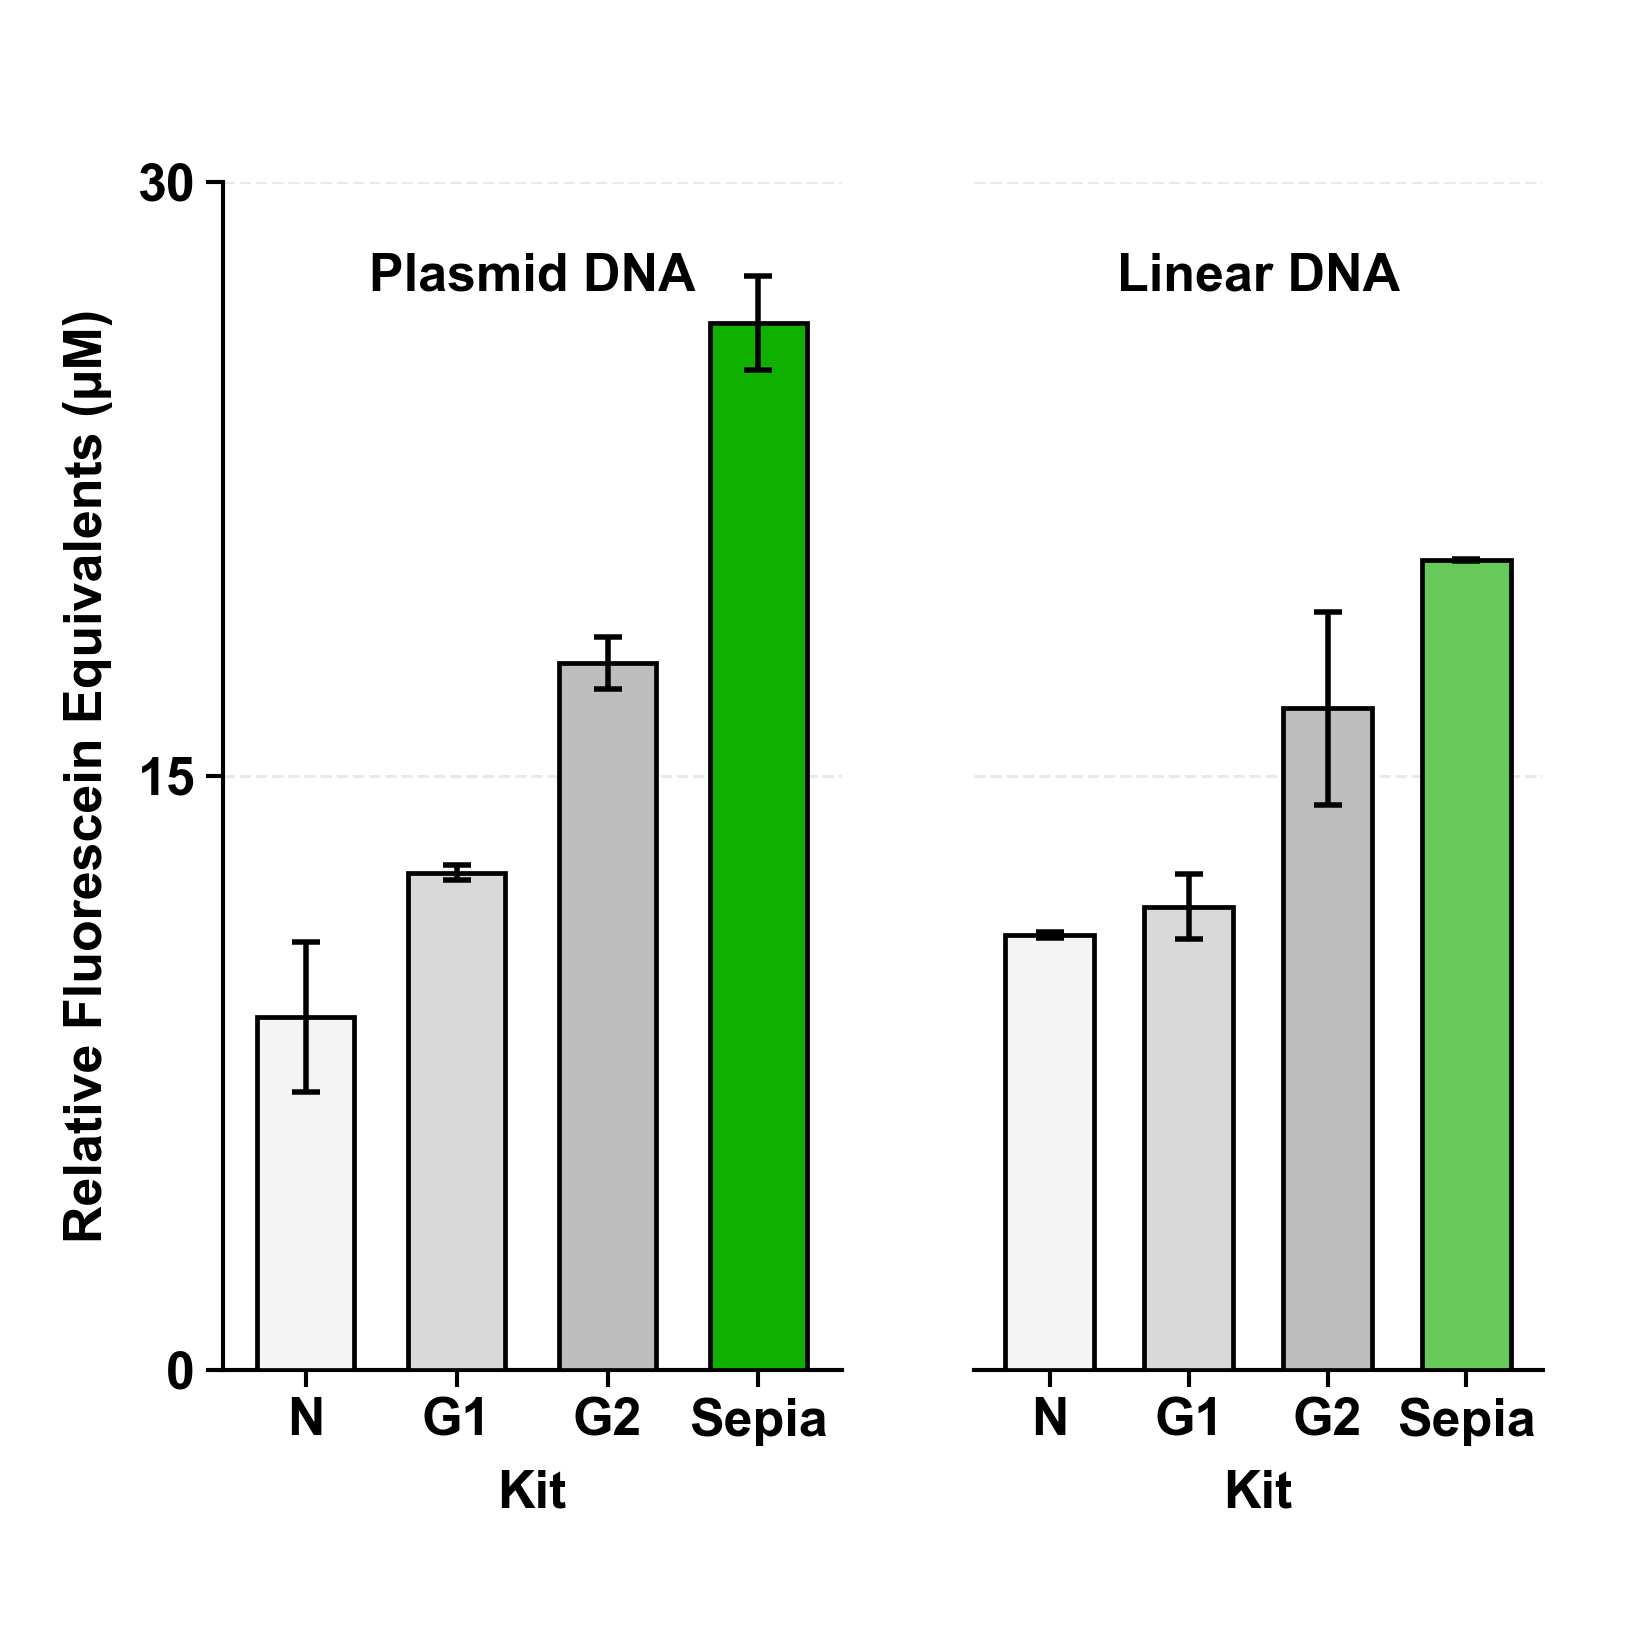
Figure 2. The OpenCFPS™ E. coli Core Kit produces superior yield compared to other industry kits. Sepia, N, G1, and G2 were run with 4 nM plasmid DNA or 8 nM linear DNA encoding sfGFP. Shown is endpoint signal in 30 µL reactions after 12 h at 29 °C.
Plasmid DNA (lot 260415) used was pS-T7-sfGFP r1. This was generated by Biozilla (Ho Chi Minh City, Vietnam) as a gigaprep, eluted in 10mM Tris pH 8.5, quantified by absorbance at 260 nm, and normalized to 200 nM. Full sequences are provided.
Linear DNA (lot 260318) used was PCR amplified (1.6 mL) against pS-T7-sfGFP r1 with Vazyme 2x RapidTaq Mix (Vazyme, Nanjing, China) and purified by salt and buffer exchange into water using a 50kDa Amicon Ultra-4 (Merck, Darmstadt, Germany). This was quantified by the AccuGreen High Sensitivity dsDNA Quantitation Kit (Biotium, California, USA) as 633 nM and normalized to 200 nM. Sequences are provided.
Cell-free reactions were done in triplicate at 30 µL on a 384-well flat-bottom plate 0720111 (Corning, New York, USA). For N, G1, G2, and Sepia, reactions were set up according to manufacturer instructions below.
For N (Massachusetts, USA), plasmid DNA reactions contained 24% extract, 50% 2X protein synthesis buffer, 2% T7 RNA polymerase, 2% murine RNase inhibitor, 2% 200 nM plasmid DNA stock, and 20% water. N linear DNA reactions contained 24% extract, 50% 2X protein synthesis buffer, 2% T7 RNA polymerase, 2% murine RNase inhibitor, 2% GamS, 4% 200 nM linear DNA stock, and 16% water.
For G1 (Nanjing, China), plasmid DNA reactions contained 33% cell extract, 52% protein synthesis buffer, 2% 200 nM plasmid DNA stock, and 13% water. G1 linear DNA reactions contained 33% cell extract, 52% protein synthesis buffer, 4% 200 nM linear DNA stock, and 11% water.
For G2 (Massachusetts, USA), plasmid DNA reactions contained 30% lysate, 50% reagent mix, 2% 200 nM plasmid DNA stock, and 18% water. G2 linear DNA reactions contained 30% lysate, 50% reagent mix, 4% 200 nM linear DNA stock, and 16% water.
For Sepia, plasmid DNA reactions contained 30% Sepia Extract E0002 lot E000225121803, 40% Sepia Buffer B0001 lot B000126022403, 2% 200 nM plasmid DNA stock, and 28% water. Sepia linear DNA reactions contained 30% Sepia Extract, 40% Sepia Buffer, 4% 200 nM linear DNA stock, and 26% water.
Each 30 µL CFPS reaction was set up independently by hand. Fluorescein control reactions were set up using the Formulatrix Mantis v3.3 ACC RFID (Formulatrix, Massachusetts, USA). On the same plate, duplicates of dilutions of fluorescein in water using 100 µM stock (in 10mM Tris-Cl, pH 9, lot 260126) were dispensed as a control. After dispensing, the plate was spun down, covered with a clear non permeable MicroAmp Clear Adhesive Film (ThermoFisher, California, USA) with a cut out for the wells to be read, then covered with a BreatheEasier film (Diversified Biotech, Massachusetts, USA). This plate was further covered with a wet paper towel, and then put in a Thermomixer C with flat plate adapter and cover (Eppendorf, Hamburg, Germany) to shake at 1200 rpm at 29°C. At t= 0 hours, 3 hours, 7 hours, and 12 hours, the plate was removed and read in a Biotek Synergy Neo2 (Agilent, California, USA) from 425 ex/528 em gain 35 (monochromator).
The final data was collected and analyzed by ChatGPT 5.6 (OpenAI, California, USA). To obtain Relative Fluorescein Equivalent (RFE) units in µM, signal collected in plate reader was calibrated to a curve-fit to the fluorescein standards collected.
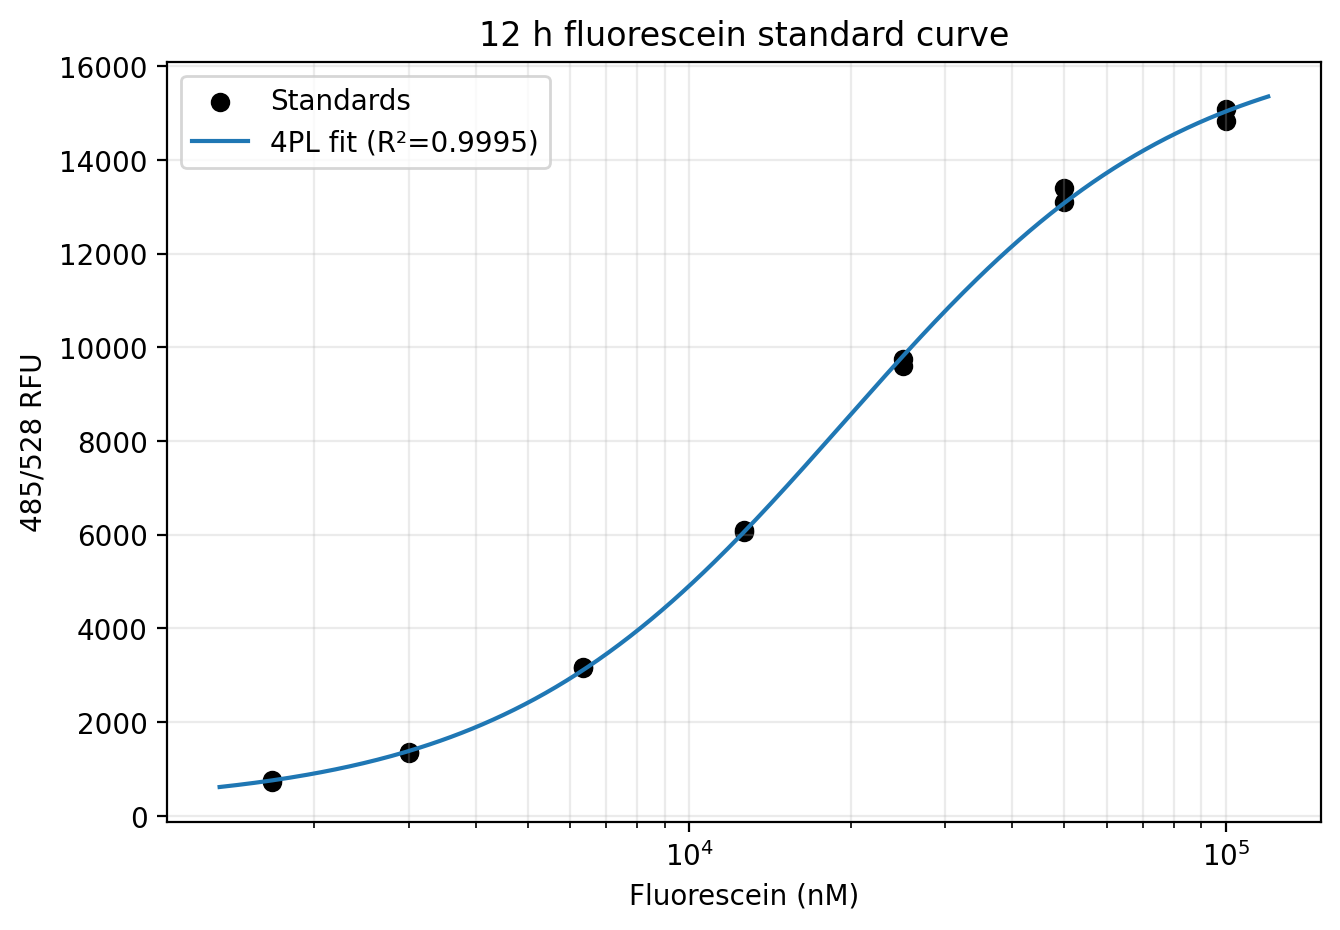
Duplicate fluorescein dilution wells were dispensed on the same plate from a 100 µM stock in water (10 mM Tris-Cl, pH 9, lot 260126) and read in the 425 ex/528 em gain 35 channel.
Those standards were used to fit the 12 h calibration curve that converts endpoint fluorescence into Relative Fluorescein Equivalent (RFE) units in µM for the GFP readout.
Colored wells show raw 485/528 fluorescence at the selected read time, using one fixed color scale across the 3 h, 7 h, and 12 h CFPS sample readouts. Switch timepoints or click a filled well to inspect the sample.
Fluorescein controls (F100-F1.7) are shown in gray and excluded from the color scale so calibration wells do not bias the sample readouts; click a gray control well to inspect its values.